ANALYTICAL REVIEW OF TB IN UKRAINE, 2013
ANALYTICAL REVIEW OF TB IN UKRAINE, 2013
Introduction
The TB epidemic in Ukraine, announced in 1995, still remains the leading cause of death and disability among infectious diseases. Despite the significant progress in strengthening diagnostic capacity and improving treatment process, many problems remain unresolved. However, more attention should be paid to an increase in the burden of multi-drug resistant tuberculosis (MDR-TB) in Ukraine and HIV infection, which increases the TB epidemic, as indicated by the consistently high prevalence of TB/HIV co-infection.
Developing and implementing new strategies for TB control must be based first of all on international experience and evidence-based medicine, it is necessary to integrate approaches with the proven efficacy and to analyse correctly epidemiological indicators that reflect both the benefits and drawbacks of TB activities in the previous years.
To evaluate the use of the full potential of primary health care services and TB service during prevention, control and treatment of tuberculosis, first of all it is necessary to consider TB case detection rate per 100 ths. of population. It demonstrates the relation between newly diagnosed TB cases (including relapses) and estimated incidences based on WHO TB global database. Figure 1 below shows a diagram of the case detection rate. As we can see the parameter in Ukraine in 2012 reached only 84.4%. This indicates that about 15.6% of TB cases is not detected in health care institutions, and as a result are not reported and treatment is not initiated.
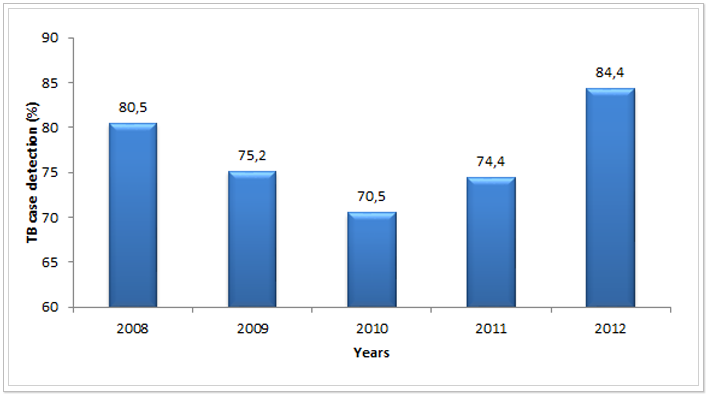 Figure 1. TB case detection rate per 100 ths. of population from 2008 to 2012 (%)*
*Data on the estimated incidence rate is taken from WHO TB World Reports of the respective years:
2008 – report 2011, 2009 – report 2012, 2010-2012 – report 2013. Data on TB reported cases in 2008-2012 are taken from the European TB report in 2014.
Based on WHO recommendations, TB case detection rate is to be constantly increasing and approaching 100%. To achieve the target it is necessary to enhance the diagnostic ability of primary health care service, to expand the access to diagnosis for TB risk groups and to monitor constantly the quality of routine surveillance.
TB notification rate
Analysing the TB notification rate in Ukraine we should pay attention to the fact that there are different approaches to the count method of this parameter. Thus, according to the WHO recommendations both newly diagnosed TB cases and relapses are taken into account in determination of the notification rate, based on the data from the cohort analysis. However, Ukraine also uses another count method, using the Soviet-style reporting forms that are currently in force, too. This method takes into account only newly diagnosed TB cases. Figure 2 shows that if the TB notification rate is analysed only based on newly diagnosed cases, it decreases (blue curve). However, when the notification rate is analysed as a set of newly diagnosed cases and relapses, we observe the opposite trend – the notification rate increases slightly (red curve).
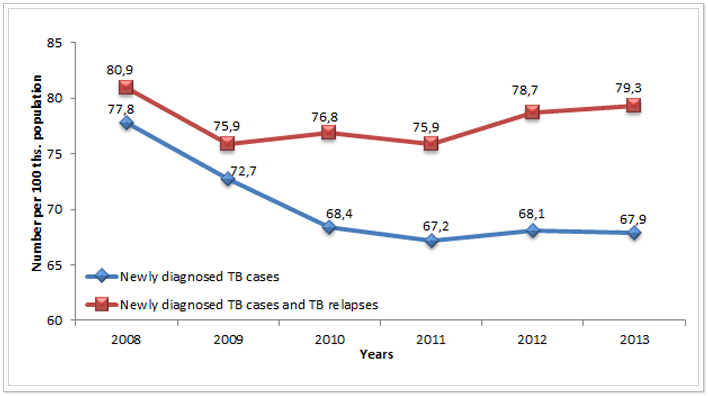 Figure 2. TB notification rate per 100 ths. 0population based on different count methods in Ukraine from 2008 to 2013*
*Data sourced from: Reporting forms TB-07 (red curve) and Reporting forms No. 8 “Report on active TB notification” (blue curve).
As for many years Ukraine has used parallel Soviet recording and reporting forms and cohort analysis forms (recommended by WHO), there are differences in the calculation of key indicators of the TB program results, because these recording and reporting systems use different definitions by reporting – i.e. “case” and “patient” and the timing of their submission. Now in Ukraine there is an urgent need for unification of the recording and reporting system and bringing it into full compliance with international recommendations. This will make it possible to carry out a competent analysis of epidemiological indicators not only within the country, but also to compare them with those of other countries, and as a result to prepare evidence base for regulatory decision-making in routine and strategic planning of TB programs at different levels.
Analysing the high incidence rate in Ukraine, it is worth remembering that it has a clear correlation with economic development of the country (see Figure 3). Therefore, planning measures to reduce the incidence rate at the national level and evaluating their efficacy it is necessary to take into account an indicator of decrease/increase in GDP per capita in these periods. The fact of the correlation between the TB incidence rate and the level of GDP per capita is a clear indication that overcoming the TB epidemic in Ukraine will be possible only in case of qualitative and positive systemic changes not only in TB service or health care, but in the economy in general.
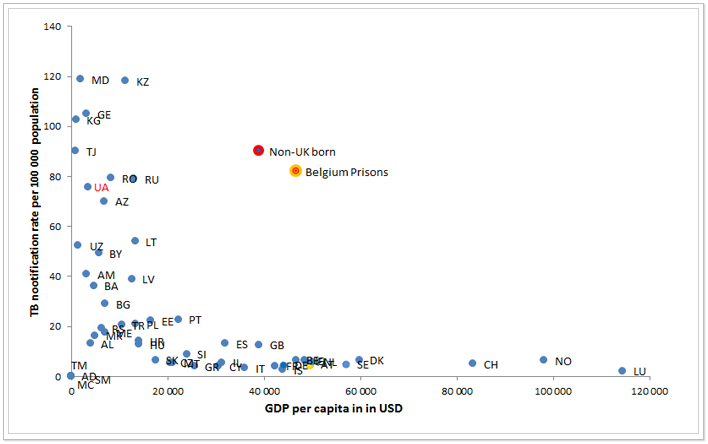 Figure 3. Correlation of TB rate (new and relapse, all forms) and GDP per capita in 49 Member States of WHO European region, 2011*
*Data sourced from WHO TB database for 2011.
One of the most important epidemiological indicators of successful TB elimination in the country is the trend of the TB notification age structure. If the average age of TB cases is growing - this indicates a positive change in the epidemiological process. Analysing the TB notification age structure in the last 5 years, traced upward trend of the notification rate for the age group 25-44 years (Figure 4), indicating the negative dynamics of the TB epidemic. This age group is the main working resource of the country and the largest taxpayer, so it is obviously that there is no reason to wait for reducing the negative impact of the TB epidemic on the economy of the state in the nearest time. However, some reduction in TB notification rate for the age group 15-24 years should be noted. But, the share of this age group in the total notification rate is small, so these positive changes cannot influence on the TB elimination in the country. In other age groups the notification rate remains approximately the same during the last 5 years.
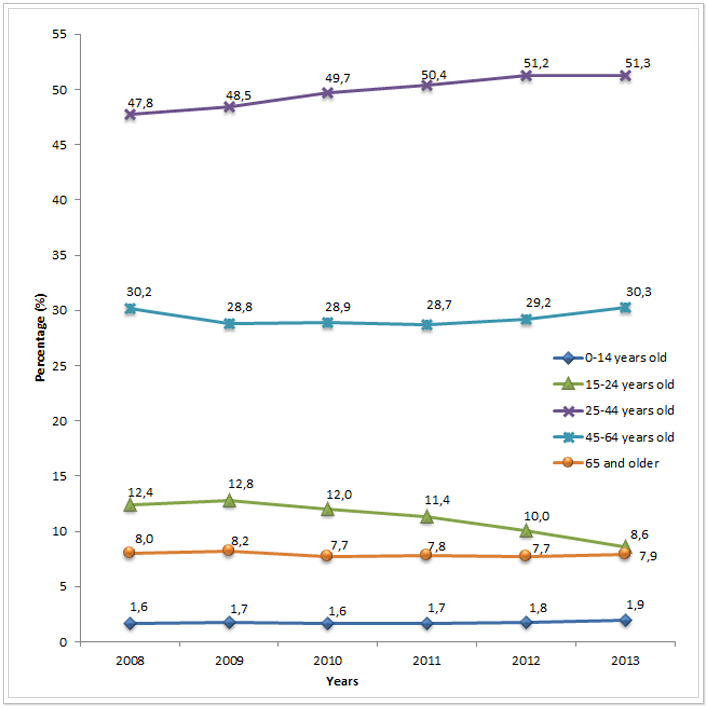
Figure 4. New TB cases by age group in Ukraine from 2008 to 2013 *
*Data sourced from the Analytical statistical handbooks “Tuberculosis in Ukraine” of the relevant years.
TB mortality rates
The TB mortality rate is also an important indicator of the impact of the TB program activities. It is a direct evidence of the effectiveness of programs of prevention, detection, diagnosis and treatment of TB. On average across Ukraine there is a decrease in TB mortality rate in the past six years (see Figure 5). In 2013, the rate was 14.1 deaths per 100 ths. of population.
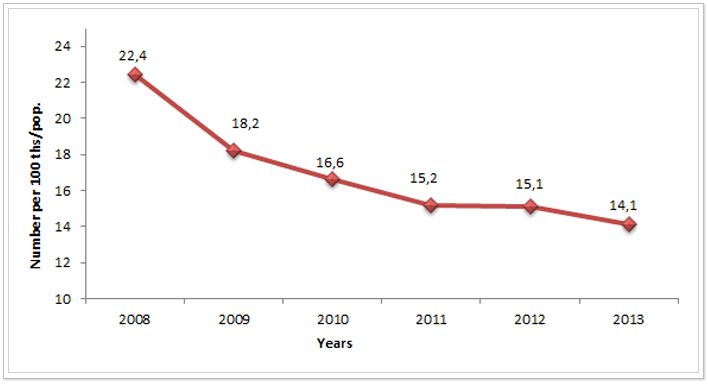 Figure 5. TB mortality rate per 100 ths. of population in Ukraine from 2008 to 2013*
*According to the data of the State Statistics Service of Ukraine.
Table 1 presents data on TB mortality rate per 100 ths. of population across the regions. In Donetsk (18.2), Dnipropetrovsk (19.5) and Luhansk (20.6) regions the mortality rate remained at a very high level last (2013) year.
Table 1. TB mortality rate per 100 ths. of population in Ukraine by the regions from 2008 to 2013*
|
Administrative units |
2008 |
2009 |
2010 |
2011 |
2012 |
2013 |
|
AR of Crimea |
23,6 |
21,8 |
21 |
19,8 |
18,1 |
15,3 |
|
Vinnytsia |
11,6 |
11,4 |
10,5 |
9,4 |
8,5 |
10,3 |
|
Volyn |
22,7 |
20,7 |
17,8 |
15,6 |
15,5 |
17,2 |
|
Dnipropetrovsk |
32,3 |
25,1 |
21,1 |
22,1 |
22 |
19,5 |
|
Donetsk |
30,6 |
25,2 |
21,5 |
18,4 |
19,6 |
18,2 |
|
Zhytomyr |
14,4 |
12,6 |
12,4 |
13 |
11,5 |
12,8 |
|
Transcarpathian Region |
18,7 |
16,4 |
14,4 |
13,9 |
12,7 |
12,6 |
|
Zaporizhzhia |
22,3 |
19 |
18,8 |
15,5 |
16,8 |
15,6 |
|
Ivano-Frankivsk |
16,3 |
13,9 |
13 |
10,9 |
10,7 |
11,1 |
|
Kyiv |
23,1 |
17 |
15,4 |
15 |
16,2 |
14,8 |
|
Kirovohrad |
27,8 |
22,3 |
22,9 |
21,1 |
19,2 |
15,2 |
|
Luhansk |
31,3 |
27,3 |
24,8 |
21,6 |
21,3 |
20,6 |
|
Lviv |
20,1 |
17,7 |
17,2 |
14,6 |
14,6 |
14,2 |
|
Mykolaiv |
21 |
18,9 |
17,3 |
14,4 |
13,1 |
12,3 |
|
Odesa |
33,8 |
21 |
20,8 |
18,8 |
17,8 |
15,9 |
|
Poltava |
22,4 |
16,2 |
15,6 |
11,5 |
14,6 |
14,5 |
|
Rivne |
17,7 |
13,1 |
12 |
9,9 |
11,1 |
11,3 |
|
Sumy |
23,9 |
20,4 |
17,7 |
18,4 |
15,3 |
14,4 |
|
Ternopil |
11 |
9,9 |
9,7 |
9,5 |
7,5 |
6,3 |
|
Kharkiv |
19,7 |
15,5 |
13,9 |
14,2 |
13,5 |
12,4 |
|
Kherson |
25,1 |
23 |
20,8 |
20,8 |
20 |
17,2 |
|
Khmelnytskyi |
13,4 |
8,7 |
9,2 |
7,4 |
8,9 |
7,6 |
|
Cherkasy |
11,8 |
11,1 |
9,8 |
10,4 |
10,5 |
10 |
|
Chernivtsi |
15,5 |
12,5 |
10,8 |
12,3 |
10,1 |
10,3 |
|
Chernihiv |
20,5 |
17,3 |
15 |
14,6 |
13,1 |
12,3 |
|
City of Kyiv |
13,5 |
10,7 |
9,3 |
7,9 |
8,8 |
7,4 |
|
City of Sevastopol |
23 |
14,8 |
18,2 |
12,9 |
13,7 |
12,3 |
|
Ukraine |
22,4 |
18,2 |
16,6 |
15,2 |
15,1 |
14,1 |
*According to the data of the State Statistics Service of Ukraine of the relevant years.
In 2013, the lowest mortality rates were recorded in Ternopil, Khmelnytskyi Regions and the City of Kyiv.
TB case detection in the primary health care network
To determine the effectiveness of measures to detect tuberculosis in institutions of primary health care (PHC) and the implementation of one of the elements of the “Stop TB” Strategy it is reasonably to consider the indicator the percentage of TB suspects who are found to be smear positive in the laboratories of primary health care. The average value of this indicator for the period from 2010 to 2013 across Ukraine is presented in Figure 6.
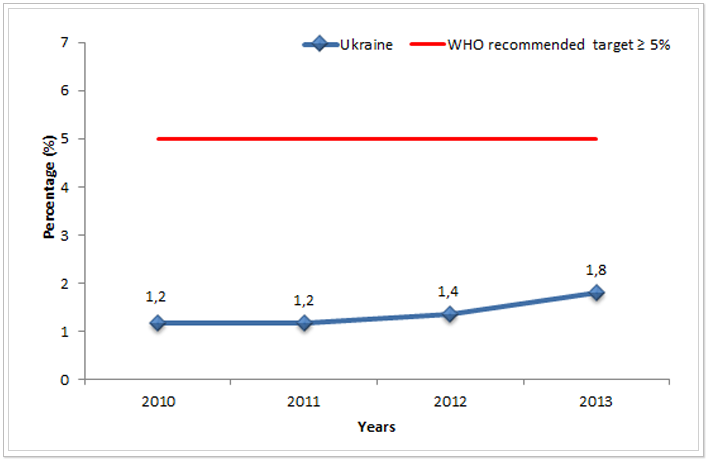 Figure 6. Percentage of TB suspects who are found to be smear positive in the laboratories of primary health care in Ukraine from 2010 to 2013*
*Data sourced from Reporting form TB-07 of the relevant years”.
According to WHO recommendations rate of TB suspects who are found to be smear positive in the laboratories of primary health care must be at the level of 5-10%. If the rate is below 5%, this may indicate that the clinical specialists refer too many patients to the sputum analysis (possibly without TB symptoms) due to increased TB alertness, and as a result laboratory services are overloaded with unnecessary negative tests, which also affects the quality of the laboratory work. Unfortunately, no region of Ukraine has reached the goal for this indicator yet (as can be seen from Table 3). Best percentage of TB suspects who are found to be smear positive in the laboratories of primary health are observed in Donetsk region (4.6% in 2013). The worst ones are in Chernivtsi, Ternopil, Lviv, Khmelnytskyi, Cherkasy and Volyn Regions, where this rate did not reach even 1% in 2013.
Table 2. Percentage of TB suspects who are found to be smear positive in the laboratories of primary health care by the regions of Ukraine from 2010 to 2013*
|
Administrative units |
2010 |
2011 |
2012 |
2013 |
|
AR of Crimea |
2,5 |
2,7 |
3 |
2,7 |
|
Vinnytsia |
1,2 |
1,4 |
2,5 |
2,1 |
|
Volyn |
1,3 |
0,8 |
1 |
0,8 |
|
Dnipropetrovsk |
1,9 |
3 |
3,7 |
3,7 |
|
Donetsk |
3,8 |
4,2 |
4,4 |
4,6 |
|
Zhytomyr |
5,7 |
2,1 |
1 |
1,2 |
|
Transcarpathian Region |
0,8 |
0,6 |
0,7 |
1 |
|
Zaporizhzhia |
1,9 |
2,1 |
2,3 |
2,8 |
|
Ivano-Frankivsk |
0,4 |
0,4 |
0,3 |
1,5 |
|
Kyiv |
0,8 |
1,3 |
1,5 |
1,2 |
|
Kirovohrad |
1 |
1,1 |
1,8 |
2,4 |
|
Luhansk |
1,1 |
1,3 |
1,3 |
3 |
|
Lviv |
0,3 |
0,6 |
0,5 |
0,7 |
|
Mykolaiv |
0,7 |
1 |
0,9 |
1,5 |
|
Odesa |
1,4 |
1,4 |
1,9 |
3,5 |
|
Poltava |
0,7 |
0,6 |
1,3 |
1,8 |
|
Rivne |
0,8 |
1,8 |
1,7 |
2,3 |
|
Sumy |
1,4 |
1,5 |
1,2 |
1,4 |
|
Ternopil |
0,3 |
0,5 |
0,5 |
0,6 |
|
Kharkiv |
1 |
1,2 |
1,3 |
1,3 |
|
Kherson |
3,4 |
3,7 |
4,4 |
3,7 |
|
Khmelnytskyi |
0,2 |
0,2 |
0,3 |
0,7 |
|
Cherkasy |
0,3 |
0,3 |
0,5 |
0,8 |
|
Chernivtsi |
0,8 |
0,3 |
0,4 |
0,6 |
|
Chernihiv |
0,7 |
1,3 |
2,5 |
3,2 |
|
City of Kyiv |
3,4 |
3,1 |
3,1 |
3,2 |
|
City of Sevastopol |
2 |
2,9 |
3,4 |
2,9 |
|
Ukraine |
1,2 |
1,2 |
1,4 |
1,8 |
*Data sourced from: Reporting form TB-07 of the relevant years.
Quality of TB diagnosis
To evaluate the use of laboratory diagnostic methods for establishing a confirmed TB case we should consider the percentage of new smear-positive TB cases out of all pulmonary TB cases. WHO recommends the rate to be higher than 50%. In Ukraine, the percentage of new smear-positive TB cases out of all pulmonary TB cases was higher than 50% since 2012 (see Figure 7).
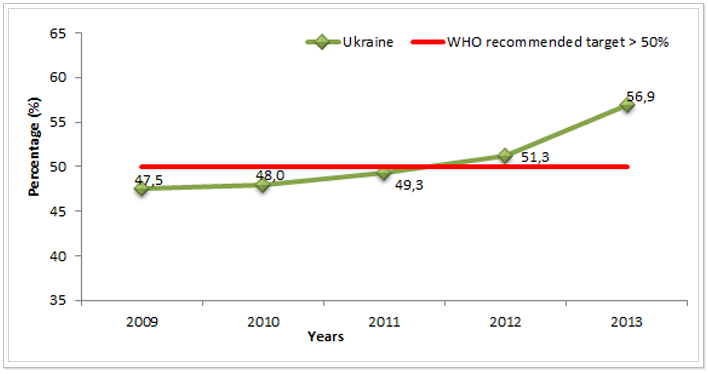 Figure 7. Percentage of new smear-positive TB cases out of all pulmonary TB cases in Ukraine from 2009 to 2013 (%) *ᵃ
* Data sourced from Reporting form TB-07 of the relevant years”.
ᵃ The rate for 2009 does not include the data from the SPS and MDU.
An important role in the improvement of the bacteriological diagnosis was played by a fast implementation of diagnostic methods within the program “Stop TB in Ukraine” under the Global Fund grant and the Charity Foundation “Development of Ukraine” in 2011-2013. Specificity and sensitivity of one of the fastest diagnostic methods using Xpert MTB/RIF are 68-98% and 98-99%, respectively. In view of this, the percentage of bacteriologically confirmed TB cases must be greater than 50%.
Previously treated TB Cases
It is very convenient to evaluate the effectiveness of TB programs of the past years using the indicator the percentage (%) of previously treated TB cases. According to WHO data the program is satisfactorily completed if it does not exceed 20%. However, as can be seen from Figure 8, the number of previously treated TB cases in Ukraine is growing rapidly. Its growth from 2012 to 2013 was 4.5%.
This high proportion of previously treated TB rate among all cases indicates the inefficiency of TB program measures in the previous years or drawbacks in reporting of TB cases; to identify and eliminate the latter is possible during monitoring visits to the regions.
For more information on this indicator in the regions of Ukraine see Table 3. In 2013, the rate of previously treated TB cases reached above 40% in Volyn, Sumy, Ivano-Frankivsk, Mykolaiv and City of Sevastopol and in treatment facilities of the Department for Execution of Punishment of Ukraine (SPS, State Penitentiary Service).
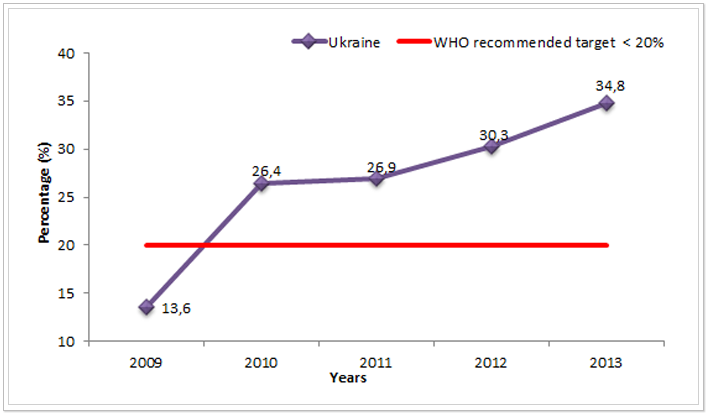 Figure 8. Percentage (%) of previously treated TB cases in Ukraine from 2009 to 2013*ᵃ
*Data sourced from Reporting form TB-07 of the relevant years”.
ᵃ The rate for 2009 does not include the data from the SPS and MDU.
Table 3. Percentage (%) of previously treated TB cases in Ukraine by the regions from 2009 to 2013*
|
Administrative units |
2009 |
2010 |
2011 |
2012 |
2013 |
|
AR of Crimea |
14,9 |
20,9 |
21,3 |
22,5 |
21,5 |
|
Vinnytsia |
16,6 |
25,6 |
23,3 |
27,5 |
30,1 |
|
Volyn |
9 |
9,1 |
9,7 |
20,7 |
40,8 |
|
Dnipropetrovsk |
11,2 |
28,2 |
32,4 |
33,6 |
37,1 |
|
Donetsk |
14,7 |
26,8 |
26,3 |
26,8 |
30,7 |
|
Zhytomyr |
9,2 |
8,9 |
12,4 |
19,1 |
23,5 |
|
Transcarpathian Region |
5,4 |
18,2 |
14 |
22,5 |
37 |
|
Zaporizhzhia |
19 |
26,4 |
26,8 |
29,8 |
27,5 |
|
Ivano-Frankivsk |
11,8 |
13,6 |
16,2 |
20,2 |
42,5 |
|
Kyiv |
10,8 |
24 |
23 |
30,4 |
33,2 |
|
Kirovohrad |
13,3 |
29,2 |
28,3 |
29,4 |
31,7 |
|
Luhansk |
22,8 |
29,7 |
31,6 |
35,1 |
39,2 |
|
Lviv |
9,3 |
15,6 |
16,6 |
21,2 |
33,5 |
|
Mykolaiv |
7,6 |
30,1 |
39,6 |
45,1 |
46,6 |
|
Odesa |
12 |
20,9 |
22,7 |
30,2 |
30,4 |
|
Poltava |
14 |
23,2 |
23,3 |
28,6 |
37,8 |
|
Rivne |
12,5 |
14,7 |
13,9 |
17,3 |
20,6 |
|
Sumy |
14,4 |
28,2 |
25,9 |
28,7 |
41,2 |
|
Ternopil |
16,4 |
20,8 |
19,6 |
23,4 |
31,4 |
|
Kharkiv |
14,9 |
25,2 |
26,3 |
30 |
30,3 |
|
Kherson |
12 |
32,2 |
35,9 |
36,6 |
37 |
|
Khmelnytskyi |
11,9 |
42,1 |
37,5 |
35 |
37 |
|
Cherkasy |
13,7 |
21,8 |
20 |
18,6 |
26,2 |
|
Chernivtsi |
12 |
14,3 |
19,8 |
22,5 |
38,1 |
|
Chernihiv |
17,5 |
18,9 |
18,1 |
22,9 |
30 |
|
City of Kyiv |
15,2 |
21,5 |
20,8 |
23,8 |
26,3 |
|
City of Sevastopol |
10,9 |
28,6 |
34,4 |
36,1 |
41,5 |
|
SPS |
- |
52,1 |
50,8 |
50,8 |
53,6 |
|
MDU |
- |
11,5 |
8,1 |
10 |
13,4 |
|
Ukraine |
13,6 |
26,4 |
26,9 |
30,3 |
34,8 |
*Data sourced from Reporting form TB-07 of the relevant years”.
Treatment coverage of pulmonary TB cases
Percentage (%) of new TB patients who were prescribed the correct regimen of medications, as described by National TB protocol (category 1-3) is also a sensitive indicator of the effectiveness of previous and current TB programs, which reflects access to TB treatment. If this indicator exceeds 100%, as it was in 2009 in Ukraine (118% - see Figure 9), this indicates that in the previous years there were interruptions in the supply of anti-TB drugs and, therefore, it was not possible to cover all patients with complete treatment immediately after registration, so they started treatment later, entering a treatment cohort of the next year. However, indicators below 100% - (2010 and 2011) show that during these intervals in Ukraine not all patients were provided with anti-TB drugs.
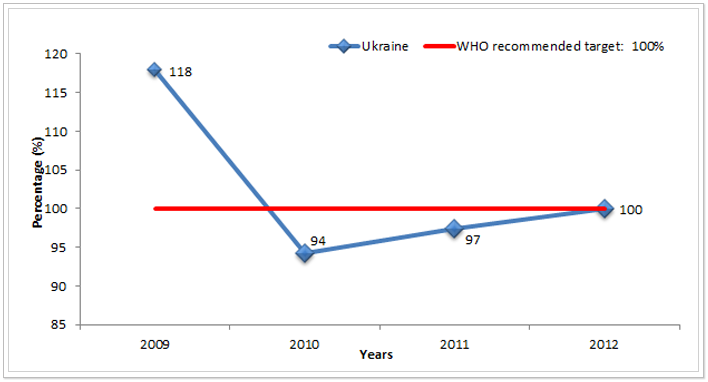
Figure 9. Percentage (%) of new TB patients who were prescribed the correct regimen of medications, as described by National TB protocol (cat. 1-3) in Ukraine from 2009 to 2012*ᵃ
*Data sourced from Reporting form TB-07 and TB 08 of the respective years.
ᵃ The rate for 2009 does not include the data from the SPS and MDU.
TB treatment success rate
To monitor TB epidemiological situation and to influence reduction of TB burden in the community, WHO recommends that treatment success rate among new bacteriologically confirmed cases of pulmonary TB (PTB) must be equal to or higher than 85%.
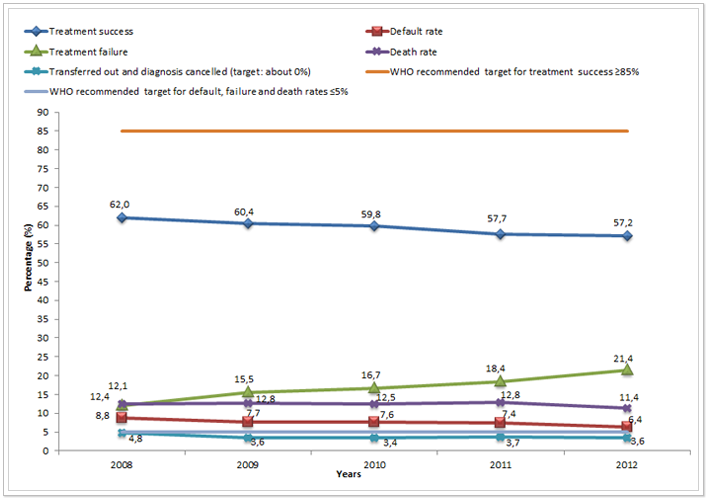
Figure 10. Treatment outcomes among new bacteriologically confirmed cases of PTB in Ukraine from 2008 to 2012*ᵃ
*Data sourced from Reporting form TB 08 of the respective years.
ᵃ The rate for 2008 and 2009 does not include the data from the SPS and MDU.
In Ukraine, this target has not been reached yet, Figure 10 shows that treatment success rate is very low and even has some tendency to decrease. Low treatment success rate (in 2012 on average across Ukraine - only 57.2%) indicates the failure of the Program to keep patients on treatment. This directly affects the further spread of tuberculosis, increased mortality from TB and development of TB resistant forms, etc. Table 4 below shows the data of treatment success rates among new bacteriologically confirmed cases of PTB in Ukraine from 2008 to 2012 by regions.
Table 4. Percentage (%) of “treatment success” among new bacteriologically confirmed cases of PTB in Ukraine by regions from 2008 to 2012*
|
Administrative units |
2008 |
2009 |
2010 |
2011 |
2012 |
|
AR of Crimea |
71,3 |
59,2 |
53,6 |
52,9 |
53,4 |
|
Vinnytsia |
61,2 |
57,2 |
58,5 |
60,6 |
61,4 |
|
Volyn |
88,1 |
83,4 |
93,6 |
83,9 |
67,2 |
|
Dnipropetrovsk |
53 |
50,9 |
48,6 |
50,7 |
49,5 |
|
Donetsk |
55,5 |
51,8 |
50 |
52,8 |
50,6 |
|
Zhytomyr |
77,4 |
79,6 |
80,5 |
71,9 |
67,8 |
|
Transcarpathian Region |
69,6 |
66 |
69,6 |
68,6 |
67,2 |
|
Zaporizhzhia |
61,5 |
64,1 |
59,1 |
56,3 |
58,9 |
|
Ivano-Frankivsk |
72,9 |
73 |
73,9 |
70,3 |
63,8 |
|
Kyiv |
70 |
62,5 |
61 |
61,4 |
63 |
|
Kirovohrad |
57,6 |
57,3 |
64,9 |
63,1 |
68,4 |
|
Luhansk |
49,1 |
52,9 |
53,4 |
44,8 |
47,7 |
|
Lviv |
88,1 |
73,6 |
68,2 |
69,5 |
69,4 |
|
Mykolaiv |
59,2 |
63,1 |
54 |
54,1 |
59,6 |
|
Odesa |
51,8 |
54,8 |
53,6 |
52,4 |
53 |
|
Poltava |
73,8 |
68,4 |
71,3 |
65,9 |
66,1 |
|
Rivne |
62,6 |
65,9 |
68,4 |
65,6 |
67,5 |
|
Sumy |
68,9 |
68 |
73,1 |
72,3 |
62,2 |
|
Ternopil |
67,4 |
77 |
75,6 |
78,2 |
77,4 |
|
Kharkiv |
48,5 |
48,9 |
48,4 |
47,9 |
48,7 |
|
Kherson |
55,4 |
51 |
57,1 |
50 |
52,5 |
|
Khmelnytskyi |
65,3 |
74,3 |
74,8 |
69,7 |
69,1 |
|
Cherkasy |
73,8 |
71,8 |
65,9 |
58,6 |
56,5 |
|
Chernivtsi |
74,1 |
82,6 |
82,2 |
78,3 |
68,3 |
|
Chernihiv |
68,7 |
62,5 |
61,8 |
60,6 |
58,6 |
|
City of Kyiv |
51,4 |
56,9 |
57 |
55,9 |
55 |
|
City of Sevastopol |
53,8 |
50 |
51,8 |
53,2 |
51,7 |
|
SPS |
- |
- |
54,2 |
39,6 |
46,4 |
|
MDU |
- |
- |
20 |
48,1 |
100 |
|
Ukraine |
62 |
58,3 |
59,8 |
57,7 |
57,2 |
* Data sourced from Reporting form TB 08 of the respective years.
As can be seen from the table, the lowest treatment success rates among new bacteriologically confirmed cases of PTB in 2012 were observed in Luhansk (47.7%), Kharkiv (48.7%), Dnipropetrovsk (49.5%) regions and in the SPS (46.4%). The highest treatment success rates in 2012 were recorded in Ternopil Region - 77.4% and the Ministry of Defence of Ukraine (100%) (MDU).
Default rate
Percentage (%) of “interrupted treatment” of new bacteriologically confirmed cases of PTB is opposite to the treatment success. Figure 9 clearly shows downward trend in treatment interruption in Ukraine over the past 5 years. However, the target set by WHO – less than 5%, is far to be achieved. Along with this there is an increasing proportion of cases where the diagnosis is cancelled or the patient is transferred out, that is, when the outcomes is not established (Figure 9). Their percentage is to be closer to 0, as in the conditions of implementation of the All-Ukrainian electronic TB case-based data manager, patient migration between regions does not affect the reporting – it is possible to get the treatment outcome, even if the patient completed treatment not in the region where it was started.
Table 5 below presents the data on the percentage of “interrupted treatment” of new bacteriologically confirmed cases of PTB in Ukraine by regions from 2008 to 2012. In 2012 the highest rates were recorded in the City of Kyiv (10.4%) and in Transcarpathian region (13%). Less than 5% rates of treatment interruption in 2012 were recorded only in six regions of Ukraine (Zhytomyr, Zaporizhzhia, Ivano-Frankivsk, Ternopil, Khmelnytskyi and Chernivtsi) and two departments - SPS and MDU.
Table 5. Percentage of “treatment interruption” among new bacteriologically confirmed cases of PTB in Ukraine by regions from 2008 to 2012*
|
Administrative units |
2008 |
2009 |
2010 |
2011 |
2012 |
|
AR of Crimea |
5,3 |
6,7 |
7,3 |
7 |
9 |
|
Vinnytsia |
9 |
12,4 |
9,1 |
7,6 |
6,3 |
|
Volyn |
1,3 |
2,5 |
0,8 |
1,6 |
8,2 |
|
Dnipropetrovsk |
12,8 |
10 |
12,4 |
9,6 |
8,5 |
|
Donetsk |
6,2 |
5,3 |
6,1 |
4,5 |
5,2 |
|
Zhytomyr |
5,1 |
4,2 |
4 |
5,2 |
2,9 |
|
Transcarpathian Region |
9,9 |
13,3 |
7,6 |
12,1 |
13 |
|
Zaporizhzhia |
8,8 |
5,9 |
7,8 |
8 |
3,4 |
|
Ivano-Frankivsk |
5,3 |
3,2 |
4,3 |
5,5 |
4,3 |
|
Kyiv |
8,7 |
8,6 |
8,3 |
8,4 |
7,3 |
|
Kirovohrad |
16,3 |
12,6 |
9,9 |
11,3 |
6,7 |
|
Luhansk |
6,8 |
6,7 |
7 |
6,8 |
7,3 |
|
Lviv |
3,1 |
6 |
8,1 |
7,2 |
7,6 |
|
Mykolaiv |
6,9 |
5 |
7,8 |
7,7 |
5,5 |
|
Odesa |
9,5 |
9,9 |
9,4 |
12,2 |
8,9 |
|
Poltava |
6,8 |
7,7 |
4,3 |
7,8 |
5,1 |
|
Rivne |
12,2 |
6,8 |
4,4 |
6 |
6,9 |
|
Sumy |
14,9 |
8,8 |
6,7 |
7,7 |
6,2 |
|
Ternopil |
5,8 |
2,5 |
4,3 |
1,9 |
0,9 |
|
Kharkiv |
11,3 |
10,6 |
11,1 |
11,1 |
6,3 |
|
Kherson |
14,1 |
10,9 |
10,1 |
10,2 |
5,7 |
|
Khmelnytskyi |
5,2 |
3,1 |
2,4 |
2,9 |
3,1 |
|
Cherkasy |
7,8 |
3,9 |
4,5 |
4,8 |
5,4 |
|
Chernivtsi |
7 |
2,5 |
3,8 |
3,1 |
2,7 |
|
Chernihiv |
6,7 |
3,2 |
4,5 |
3,5 |
6,1 |
|
City of Kyiv |
18,2 |
18,2 |
12,7 |
11,2 |
10,4 |
|
City of Sevastopol |
6,8 |
10 |
12,5 |
13,8 |
6,9 |
|
SPS |
- |
- |
3,5 |
0,5 |
0,2 |
|
MDU |
- |
- |
0 |
0 |
0 |
|
Ukraine |
8,8 |
7,7 |
7,6 |
7,4 |
6,4 |
*Data sourced from Reporting form TB 08 of the respective years.
TB treatment failure rate
Percentage (%) of “treatment failure” of new bacteriologically confirmed cases of PTB is used to assess the quality of implementation of DOT strategy and correct diagnosis of TB in the country. Of course, no TB program can provide zero rate of treatment failure, WHO recommends trying to reduce it to the rate less than 5% of all treatment outcomes of newly diagnosed cases of pulmonary TB with positive bacterioscopy. Unfortunately, this rate is growing rapidly in Ukraine over the past 5 years (Figure 9). Thus, from 2008 to 2012, the percentage of “treatment failure” of new bacteriologically confirmed cases of PTB increased by more than 9% (from 12.1% to 21.4%, respectively).
None of the regions achieved PTB “treatment failure” rate below 5% in 2012. Three regions were close to it: Transcarpathian Region (12.4%), Kirovohrad (12.6%) and Ternopil (12.8%). Furthest Luhansk (28.7%) and Kharkiv (30.7%) regions were from achieving the target (see Table 6).
Among three reasons for treatment failure (continued bacterial excretion, progression of pulmonary process on X-ray, diagnosis of multidrug resistant TB (MDR-TB)) the largest part belongs to MDR-TB diagnosis. And it should be taken into account that the proportion of MDR-TB among these reasons for treatment failure increases every year. For example, in 2009 it was 43.3% of all cases of treatment failure, in 2012, it was already 63.6%. The important role in such dynamics is played by implementation of molecular genetic diagnostic methods, due to higher values of sensitivity of these methods. The next most common reason for treatment failure has become progression of pulmonary process on X-ray; in 2012 it was 23.4% of all cases of treatment failure. Progression of pulmonary process is mostly typical for patients co-infected with TB/HIV. And the smallest share among the reasons for treatment failure was continuation or appearance of bacterial excretion - 13%; it may indicate non-compliance with the principle of controlled treatment and interruption of medication administration.
Table 6. Percentage (%) of “treatment failure” among new bacteriologically confirmed cases of PTB in Ukraine by regions from 2008 to 2012*
|
Administrative units |
2008 |
2009 |
2010 |
2011 |
2012 |
|
AR of Crimea |
11,6 |
15,8 |
20,9 |
20,9 |
21,8 |
|
Vinnytsia |
11,9 |
14,8 |
16,8 |
17,8 |
18,1 |
|
Volyn |
9,1 |
10,8 |
2,6 |
6,9 |
14,6 |
|
Dnipropetrovsk |
14,3 |
18,9 |
21,5 |
22,6 |
23,4 |
|
Donetsk |
12 |
22,7 |
23 |
22,9 |
27,3 |
|
Zhytomyr |
5,8 |
5,8 |
4,9 |
10 |
14,4 |
|
Transcarpathian Region |
14,2 |
13 |
16,5 |
15,5 |
12,4 |
|
Zaporizhzhia |
13,2 |
16,3 |
19,6 |
20,1 |
24,1 |
|
Ivano-Frankivsk |
7,7 |
8,4 |
8,5 |
12,4 |
17,4 |
|
Kyiv |
6,2 |
14,3 |
17,5 |
18 |
13,5 |
|
Kirovohrad |
12,1 |
16,7 |
12,8 |
11,1 |
12,6 |
|
Luhansk |
19,2 |
17,8 |
22,6 |
31,5 |
28,7 |
|
Lviv |
2,2 |
13,9 |
14,5 |
14,1 |
14,9 |
|
Mykolaiv |
8,5 |
6,9 |
12,8 |
14,4 |
19,5 |
|
Odesa |
18 |
11,6 |
12,7 |
15,3 |
22,3 |
|
Poltava |
7,6 |
10 |
10,8 |
10,5 |
13,7 |
|
Rivne |
7,6 |
17,2 |
16,5 |
17,7 |
16,4 |
|
Sumy |
9,4 |
16,5 |
11,7 |
12,3 |
23,8 |
|
Ternopil |
16,2 |
10,3 |
6,3 |
8 |
12,8 |
|
Kharkiv |
20,4 |
20,4 |
23,2 |
23,8 |
30,7 |
|
Kherson |
15,4 |
21,7 |
17,4 |
19,5 |
27,4 |
|
Khmelnytskyi |
12,1 |
7,7 |
9,4 |
11,9 |
16,7 |
|
Cherkasy |
6,3 |
7,8 |
13,7 |
15,4 |
18,8 |
|
Chernivtsi |
2,8 |
6,6 |
5,7 |
3,7 |
16,5 |
|
Chernihiv |
9,2 |
18,7 |
17,4 |
23,4 |
19,6 |
|
City of Kyiv |
10,6 |
14,9 |
14,5 |
16,9 |
22 |
|
City of Sevastopol |
19,7 |
20 |
17,9 |
20,2 |
27,6 |
|
SPS |
- |
- |
16,9 |
25 |
25,1 |
|
MDU |
- |
- |
0 |
0 |
0 |
|
Ukraine |
12,1 |
15,5 |
16,7 |
18,4 |
21,4 |
* Data sourced from Reporting form TB 08 of the respective years.
Death rate among new bacteriologically confirmed cases of PTB
Percentage of “deaths” among new bacteriologically confirmed cases of PTB is a sensitive indicator of efficiency and quality of the State targeted social programs to combat TB, as well as their coordination with programs combating HIV/AIDS. Remember that it should be considered in the context of the prevalence of TB/HIV co-infection and MDR-TB, which is typical for Ukraine. Figure 10 shows that the percentage of “deaths” among new bacteriologically confirmed cases of PTB remains quite high and almost unchanged (from 2008 to 2012, the rate declined only by 1%).
This indicator is affected with the timing of TB case detection, i.e. its indicator reflects patients' access to TB diagnosis. In addition, it significantly is affected with the coverage of TB patients with HIV testing, as well as coverage of TB/HIV co-infected patients with antiretroviral therapy and Co-trimoxazole prophylaxis. As with previous indicators to identify correctly the percentage of “deaths” among new bacteriologically confirmed cases of PTB, it is necessary to obtain treatment outcomes in accordance with the approved terms and definitions, to provide regularly reports on the cohort analysis. Therefore, it is clear that the rapid growth of this indicator, such as in Volyn Region (from 0.6% in 2008 to 8.2% in 2012) indicates establishing a system of reporting and data reliability after appropriate training for health care workers, but not aggravation of the epidemic process (Table 7). Also in Table 7 below, it can be seen more data on this indicator in the context of all the regions of Ukraine in the last 5 years for which outcomes are known.
Table 7. Percentage (%) of “deaths” among new bacteriologically confirmed cases of PTB in Ukraine by the regions from 2008 to 2012*
|
Administrative units |
2008 |
2009 |
2010 |
2011 |
2012 |
|
AR of Crimea |
8,8 |
15,3 |
15,5 |
16 |
12,2 |
|
Vinnytsia |
13,6 |
12,9 |
14,1 |
10,4 |
11,2 |
|
Volyn |
0,6 |
2,5 |
2,6 |
6,9 |
8,2 |
|
Dnipropetrovsk |
14,1 |
16,8 |
13,4 |
13,5 |
15 |
|
Donetsk |
18,4 |
16,7 |
16,7 |
16,9 |
15,4 |
|
Zhytomyr |
9,1 |
7 |
9,8 |
12 |
12,9 |
|
Transcarpathian Region |
4,4 |
6,3 |
5 |
3,1 |
6,1 |
|
Zaporizhzhia |
10,4 |
8,7 |
9,2 |
10,9 |
9,7 |
|
Ivano-Frankivsk |
10,3 |
13 |
11,1 |
7,6 |
9,6 |
|
Kyiv |
12,7 |
12,1 |
11,7 |
10,1 |
13,7 |
|
Kirovohrad |
10,6 |
11 |
10,5 |
13,2 |
10,2 |
|
Luhansk |
17 |
15,9 |
14,2 |
13,3 |
13,1 |
|
Lviv |
6,2 |
5,3 |
7,3 |
7,6 |
6,5 |
|
Mykolaiv |
18,3 |
20,6 |
21,2 |
20 |
12 |
|
Odesa |
15,7 |
18,6 |
20,3 |
18,3 |
13,9 |
|
Poltava |
9,2 |
12,1 |
9,6 |
12,9 |
12,3 |
|
Rivne |
14,7 |
8,8 |
9,2 |
7,8 |
7,9 |
|
Sumy |
4,5 |
2,6 |
4,2 |
5,2 |
4,6 |
|
Ternopil |
8,2 |
8,5 |
10,6 |
11,5 |
7,7 |
|
Kharkiv |
13,3 |
14,2 |
12,9 |
12,3 |
10,8 |
|
Kherson |
10,4 |
12,3 |
9,2 |
15,9 |
10,9 |
|
Khmelnytskyi |
13,6 |
12,3 |
10,1 |
11,2 |
9,4 |
|
Cherkasy |
8,7 |
12,6 |
14 |
18,5 |
13,7 |
|
Chernivtsi |
7 |
7,4 |
7 |
11,8 |
9,4 |
|
Chernihiv |
12,9 |
13,1 |
14 |
10,8 |
13,2 |
|
City of Kyiv |
13,3 |
5,8 |
11,4 |
11,6 |
9,1 |
|
City of Sevastopol |
15,4 |
13,6 |
13,4 |
11 |
8,6 |
|
SPS |
- |
- |
4,9 |
9,4 |
5,3 |
|
MDU |
- |
- |
0 |
0 |
0 |
|
Ukraine |
12,4 |
12,8 |
12,5 |
12,8 |
11,4 |
*Data sourced from Reporting form TB 08 of the respective years.
HIV/TB co-infection
Tuberculosis in combination with human immunodeficiency virus (HIV) is currently one of the major problems that need to be solved in overcoming the TB epidemic in Ukraine. According to the data, HIV prevalence among newly diagnosed TB cases is growing rapidly. In 2013, 16.7% of newly diagnosed TB cases in Ukraine had a combined disease caused by HIV (see Figure 11). Compared to 2008, the rate in the country grew by more than half.
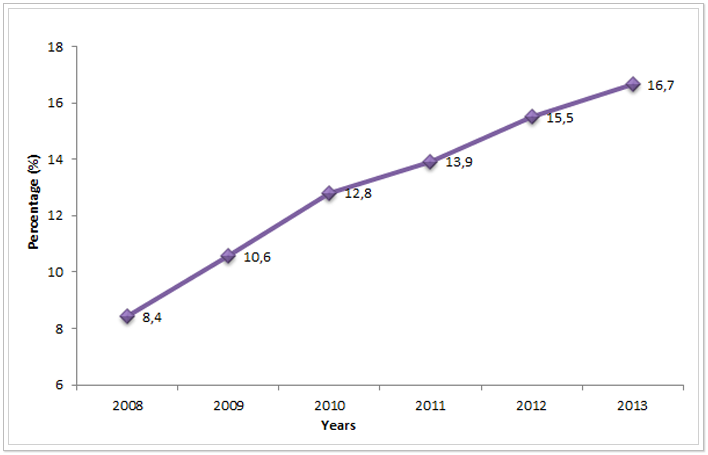
Figure 11. HIV prevalence among newly diagnosed TB cases in Ukraine from 2010 to 2013*ᵃ
*2008-2009 data sourced from Reporting form No. 33 “Report on tuberculosis” of the respective years. 2010-2013 data sourced from Reporting form TB-07.
ᵃThe rate for 2010 does not include the data from the SPS and MDU.
The greatest burden of HIV-associated tuberculosis is observed in the south-eastern regions of Ukraine. So in these four regions, HIV prevalence among newly diagnosed TB cases reached more than 25%: in Mykolaiv (26.5%), Dnipropetrovsk (26.8%), Odesa (29.5%) and Donetsk (31.6%) regions. More data for this indicator in other regions of Ukraine can be found in Table 8, which is presented below.
Table 8. HIV prevalence among newly diagnosed TB cases in Ukraine by regions from 2008 to 2013*
|
Administrative units |
2008 |
2009 |
2010 |
2011 |
2012 |
2013 |
|
AR of Crimea |
11,3 |
16,4 |
17,8 |
19,8 |
18,8 |
18,7 |
|
Vinnytsia |
3,3 |
4,4 |
3,7 |
5 |
5,3 |
6,2 |
|
Volyn |
2,5 |
2,9 |
4,3 |
4,8 |
6,7 |
7,4 |
|
Dnipropetrovsk |
9 |
16,8 |
20,9 |
24,6 |
25,3 |
26,8 |
|
Donetsk |
19,8 |
22,8 |
23,8 |
24,1 |
29,1 |
31,6 |
|
Zhytomyr |
4,2 |
5,5 |
6,8 |
9,8 |
10,7 |
10,1 |
|
Transcarpathian Region |
0,4 |
0,9 |
0,8 |
0,9 |
1,8 |
2,5 |
|
Zaporizhzhia |
5,6 |
4,3 |
9,2 |
10 |
11,8 |
12 |
|
Ivano-Frankivsk |
2,3 |
1,6 |
2,5 |
3,7 |
3,3 |
3,7 |
|
Kyiv |
4,9 |
8,7 |
10,4 |
11 |
13,9 |
18,8 |
|
Kirovohrad |
4,1 |
6,1 |
8,3 |
9,9 |
11,5 |
13,8 |
|
Luhansk |
5 |
4,2 |
8,1 |
8,3 |
10 |
11,5 |
|
Lviv |
2,4 |
2,6 |
4,1 |
4,4 |
6,1 |
6,3 |
|
Mykolaiv |
28,6 |
25,1 |
26,5 |
25 |
24,3 |
26,5 |
|
Odesa |
15,2 |
18,3 |
19,2 |
21,9 |
24,7 |
29,5 |
|
Poltava |
4,6 |
7,8 |
8,1 |
10,2 |
12,8 |
12,1 |
|
Rivne |
0,1 |
1,5 |
3,3 |
3,1 |
5,5 |
5,7 |
|
Sumy |
2,4 |
3,4 |
2,7 |
4,1 |
5,7 |
4,6 |
|
Ternopil |
1,9 |
1,5 |
2,2 |
2,6 |
2,4 |
2,9 |
|
Kharkiv |
3,8 |
5,4 |
5,7 |
5,4 |
7,3 |
6,1 |
|
Kherson |
6,4 |
7,5 |
10,1 |
13,1 |
14,2 |
14,7 |
|
Khmelnytskyi |
3,1 |
3,1 |
6,1 |
8,2 |
10,5 |
7,6 |
|
Cherkasy |
9,4 |
11 |
15,5 |
14,7 |
18,9 |
14,6 |
|
Chernivtsi |
2,6 |
2,2 |
5,3 |
2,2 |
2,7 |
3,7 |
|
Chernihiv |
8,5 |
10,2 |
12,5 |
14,7 |
15 |
14 |
|
City of Kyiv |
10,4 |
13,3 |
16,3 |
16,5 |
23,2 |
24,9 |
|
City of Sevastopol |
17,1 |
20,6 |
21,9 |
25,1 |
23,5 |
24,1 |
|
SPS |
- |
- |
17,7 |
19,1 |
15,2 |
18,5 |
|
MDU |
- |
- |
6,5 |
1,6 |
3,2 |
2,4 |
|
Ukraine |
8,4 |
10,6 |
12,8 |
13,9 |
15,5 |
16,7 |
* 2008-2009 data sourced from Reporting form No. 33 “Report on tuberculosis” of the respective years. 2010-2013 data sourced from Reporting form TB-07 of the relevant years.
The prevalence of TB/HIV co-infection is affected with the quality of preventive and therapeutic measures which are coordinated and implemented by AIDS Service. The important role is played by ongoing TB screening and Isoniazid prophylaxis of patients with HIV infection, as well as timely appointment of ART therapy in patients with HIV infection.
Coverage with first-line drug testing
To determine the burden of MDR-TB among new cases and retreatment cases, as well as timely and correct determination of resistance profile of TB cases, WHO recommends approaching 100% coverage with sensitivity test to first-line drugs among reported cases of pulmonary TB (cat. 1-3). In 2013 in Ukraine, access to drug sensitivity tests (DST) to first-line anti-TB drugs was received by 47.8% of patients of all reported cases of PTB (cat. 1-3). As can be seen from Figure 12 increased coverage with DST in Ukraine is very slow, within 4 years this rate increased only by 4.4%.
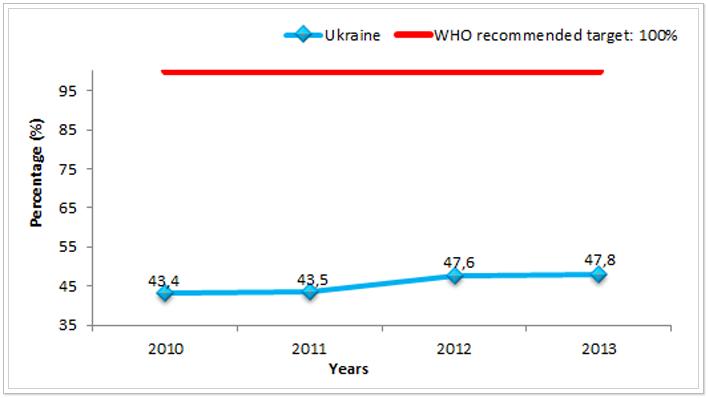
Figure 12. Percentage of coverage with first-line drug sensitivity testing among reported cases of PTB (cat. 1-3) in Ukraine from 2010 to 2013*ᵃ
* Data sourced from Reporting form TB 11 “Study report on the resistance of Mycobacterium tuberculosis to antimycobacterial drugs in patients with pulmonary tuberculosis, reported 12-15 months ago” of the relevant years.
ᵃ The rate for 2010 does not include the data from the SPS and MDU.
Possible reasons for low coverage with first-line drug sensitivity test among reported cases of pulmonary TB are irregular supply of consumables; poor quality of consumables or laboratory tests; inadequate transportation of materials for examination from the district level to the regional one (last item is particularly relevant in the implementation of outpatient treatment model).
The lowest coverage with DST in 2013 was observed among patients of the penitentiary sector - only 8.9%. This is due to the lack of consumables for this diagnosis, due to lack of funding. Also, very low coverage with DST was recorded in Transcarpathian Region - only 15.9% of all reported cases of PTB in 2013. However, over the last year in seven regions first-line drug sensitivity tests reached 60% and above, these are the regions such as Vinnytsia (60.8%), Zhytomyr (64.2%), Zaporizhzhia (60.0%), Odesa (68.3%), Kharkiv (69.5%), Chernivtsi (63.5%) and Chernihiv (65.7) (see Table 9).
Table 9. Percentage of coverage with first-line drug sensitivity testing among reported PTB cases (cat. 1-3) in Ukraine by the regions from 2010 to 2013*
|
Administrative units |
2010 |
2011 |
2012 |
2013 |
|
AR of Crimea |
33,4 |
34 |
39,5 |
36,4 |
|
Vinnytsia |
54 |
45,8 |
53,1 |
60,8 |
|
Volyn |
58,5 |
56,2 |
74,4 |
53,1 |
|
Dnipropetrovsk |
41,8 |
43,3 |
42,7 |
51,3 |
|
Donetsk** |
48,3 |
56,3 |
64,6 |
60,3 |
|
Zhytomyr |
41,1 |
55,6 |
61,8 |
64,2 |
|
Transcarpathian Region |
49,3 |
41,6 |
27,1 |
15,9 |
|
Zaporizhzhia |
56,2 |
53,7 |
52 |
60 |
|
Ivano-Frankivsk |
8,9 |
18,3 |
30,8 |
51,5 |
|
Kyiv |
39,4 |
36,3 |
42,2 |
53,1 |
|
Kirovohrad |
33,2 |
32,5 |
31,1 |
48,8 |
|
Luhansk |
36,8 |
42,7 |
43,9 |
54,4 |
|
Lviv |
40,2 |
43,1 |
49,2 |
57,9 |
|
Mykolaiv |
38,8 |
44,3 |
44,9 |
58,9 |
|
Odesa |
49 |
50,7 |
57,1 |
68,3 |
|
Poltava |
39 |
41 |
41,5 |
49,5 |
|
Rivne |
34,9 |
41,3 |
54,8 |
57,8 |
|
Sumy |
45,6 |
45,6 |
46,6 |
56,8 |
|
Ternopil |
34,4 |
51,3 |
53 |
58,8 |
|
Kharkiv |
55,1 |
50,7 |
58 |
69,5 |
|
Kherson |
38,7 |
38 |
40,4 |
53,3 |
|
Khmelnytskyi |
45,4 |
47,1 |
47,4 |
50,1 |
|
Cherkasy |
58,4 |
52,6 |
52,2 |
55,9 |
|
Chernivtsi |
40,6 |
41,6 |
55,1 |
63,5 |
|
Chernihiv |
60,5 |
61 |
58,6 |
65,7 |
|
City of Kyiv |
39,4 |
41,7 |
46,1 |
48,6 |
|
City of Sevastopol |
56,3 |
59,1 |
62,8 |
53,6 |
|
SPS |
- |
18,2 |
34,8 |
8,9 |
|
MDU |
- |
5,2 |
7,9 |
28,1 |
|
Ukraine |
43,4 |
43,5 |
47,6 |
47,8 |
*Data sourced from Reporting form TB 11 “Study report on the resistance of Mycobacterium tuberculosis to antimycobacterial drugs in patients with pulmonary tuberculosis, reported 12-15 months ago” of the relevant years.
**Data from Donetsk region in 2013 are provided only for the 1st quarter, as reports from the region in form TB 11 are submitted with a lag of 1 year.
Prevalence of multidrug-resistant tuberculosis
The burden of MDR-TB in Ukraine is growing rapidly. From 2010 to 2013, the prevalence of MDR-TB among reported newly diagnosed PTB cases increased almost by 7% (see Figure 13).
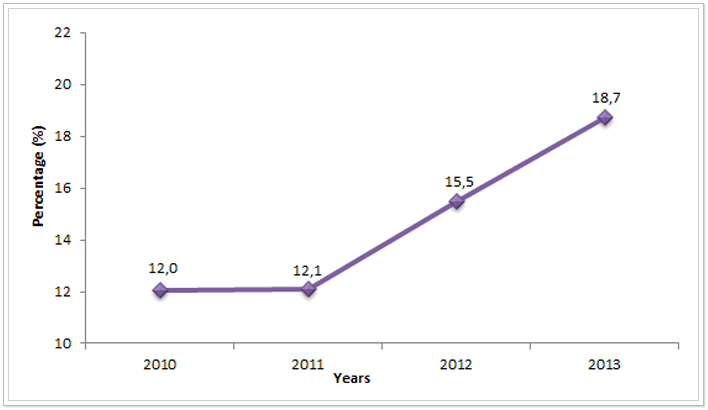
Figure 13. Prevalence of MDR-TB among reported newly diagnosed cases of PTB in Ukraine from 2010 to 2013*ᵃ
* Data sourced from Reporting form TB 11 “Study report on the resistance of Mycobacterium tuberculosis to antimycobacterial drugs in patients with pulmonary tuberculosis, reported 12-15 months ago” of the relevant years.
ᵃ The rate for 2010 does not include the data from the SPS and MDU.
More detailed information on this indicator across the regions is presented in Table 10. Only in four regions (Zhytomyr, Ivano-Frankivsk, Kyiv and Khmelnytskyi) and in the treatment facilities of the Ministry of Defence of Ukraine MDR-TB prevalence among new cases of PTB was below 10%. Despite the general upward trend in MDR-TB prevalence in Ukraine, in some regions MDR-TB prevalence decreased in 2013 compared to the previous years. For example, in Cherkasy Region, the indicator fell by 3.9% in 2013 compared with 2010, in Ivano-Frankivsk – by 7.2%, in the SPS – by 7.8% and in Rivne – by 18.1%. However, this reduction cannot be assessed as a positive trend of the epidemiological process in Ukraine in general, as in other regions there is an increase in the proportion of MDR-TB among newly diagnosed cases, the highest rates in 2013 were in the following regions: ARC - 27.1% increase, in Kharkiv Region – 27.5%, Mykolaiv – 28.7% and in Kherson – 28.9%. Therefore, as described above, the indicators of a decrease of MDR-TB prevalence in certain regions should be considered as a possible signal of problems with MDR-TB diagnosis (no access or limited access to the drug sensitivity test, molecular genetic diagnostic methods, diagnostic algorithm violations, etc.), or it may indicate poor reporting and inaccurate data. Assessment of the quality of routine surveillance data on MDR-TB prevalence among reported TB cases will be possible after the publication of the results of the study to determine the prevalence of resistant strains of Mycobacterium tuberculosis in Ukraine, which WHO has been carried out in 2013-2014.
Table 10. MDR-TB prevalence among reported newly diagnosed cases of PTB in Ukraine by the regions from 2010 to 2013*
|
Administrative units |
2010 |
2011 |
2012 |
2013 |
|
AR of Crimea |
13,6 |
22,3 |
24,5 |
27,1 |
|
Vinnytsia |
12,9 |
9,8 |
13,2 |
17,8 |
|
Volyn |
4,3 |
4 |
11 |
13,1 |
|
Dnipropetrovsk |
15,8 |
17,4 |
20,6 |
24 |
|
Donetsk** |
18,2 |
17,9 |
21,3 |
23,1 |
|
Zhytomyr |
3,8 |
2,1 |
3,1 |
8,1 |
|
Transcarpathian Region |
3 |
6,4 |
8,7 |
17 |
|
Zaporizhzhia |
8,4 |
10,8 |
13,5 |
23 |
|
Ivano-Frankivsk |
12,5 |
9,7 |
3,1 |
5,3 |
|
Kyiv |
3,3 |
4,1 |
5,5 |
9,5 |
|
Kirovohrad |
6,3 |
3,1 |
7,6 |
14,9 |
|
Luhansk |
18,8 |
11,7 |
16,6 |
21,9 |
|
Lviv |
12,7 |
12,8 |
13,6 |
11,1 |
|
Mykolaiv |
2,6 |
5,4 |
9,3 |
28,7 |
|
Odesa |
8,5 |
7,1 |
14,2 |
21,7 |
|
Poltava |
16,8 |
15,5 |
9,3 |
15,8 |
|
Rivne |
29,3 |
15,7 |
11,1 |
11,2 |
|
Sumy |
5,6 |
4,7 |
18,4 |
17,9 |
|
Ternopil |
5,9 |
5,9 |
12,4 |
10,9 |
|
Kharkiv |
16,5 |
15,8 |
24,8 |
27,5 |
|
Kherson |
14,1 |
10,7 |
19,2 |
28,9 |
|
Khmelnytskyi |
2,8 |
5,8 |
5,2 |
5,6 |
|
Cherkasy |
15,4 |
20,2 |
10,5 |
11,5 |
|
Chernivtsi |
1,9 |
1,9 |
8 |
17,7 |
|
Chernihiv |
13,4 |
15,8 |
20,7 |
22 |
|
City of Kyiv |
8,8 |
12,4 |
16,2 |
21 |
|
City of Sevastopol |
9,3 |
6,4 |
11,2 |
10,9 |
|
SPS |
- |
22,9 |
25 |
15,1 |
|
MDU |
- |
0 |
11,1 |
8,3 |
|
Ukraine |
12 |
12,1 |
15,5 |
18,7 |
*Data sourced from Reporting form TB 11 “Study report on the resistance of Mycobacterium tuberculosis to antimycobacterial drugs in patients with pulmonary tuberculosis, reported 12-15 months ago” of the relevant years.
**Data from Donetsk region in 2013 are provided only for the 1st quarter, as reports from the region in form TB 11 are submitted with a lag of 1 year.
Treatment coverage of MDR-TB cases
According to the international guidelines, treatment coverage of patients with MDR-TB and extensively drug-resistant TB (XDR-TB) must be equal to 100%. Only providing with anti-TB drugs of all patients for completing a full course of treatment can have a positive impact on reducing the incidence rate of MDR-TB in Ukraine. Unfortunately, from 2008 to 2012, the country experienced significant problems with the supply of second-line anti-TB drugs for the treatment of MDR-TB patients. The state is not able to provide free treatment for all patients with MDR-TB. As can be seen from Figure 14 in 2013, the percentage of reported cases of M/XDR-TB covered with the treatment according to the National TB protocol was 100.5%. That is the treatment involved not only patients notified in 2013, but the patients notified in the previous years, though without treatment then due to lack of drugs.
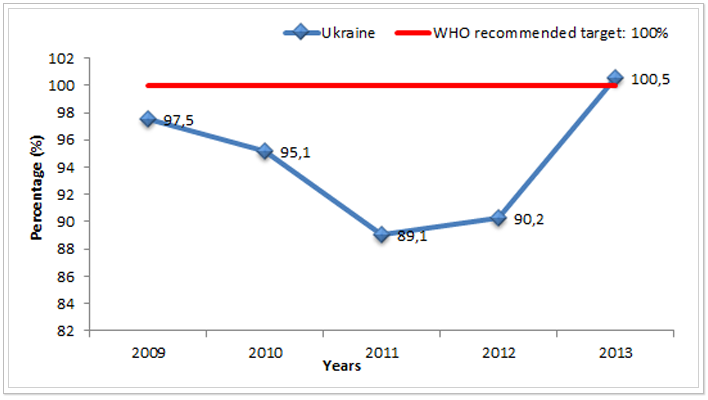
Figure 14. Percentage of notified M/XDR-TB cases covered with treatment according to the National TB protocol in Ukraine from 2009 to 2013*ᵃ
*Data sourced from Reporting form TB-07 MDR-TB of the relevant years.
ᵃ The rate for 2009-2012 does not include the data from the SPS and MDU.
Within the implementation of Round 9 of the Global Fund grant to Fight AIDS, Tuberculosis and Malaria by the component “TB” since 2012 Ukraine has been procuring second-line drugs by full regimens for a part of MDR-TB patients. Thus in 2013, about 12% (960 treatment regimens) of all MDR-TB patients in Ukraine were provided with a full course of treatment under the Global Fund grant.
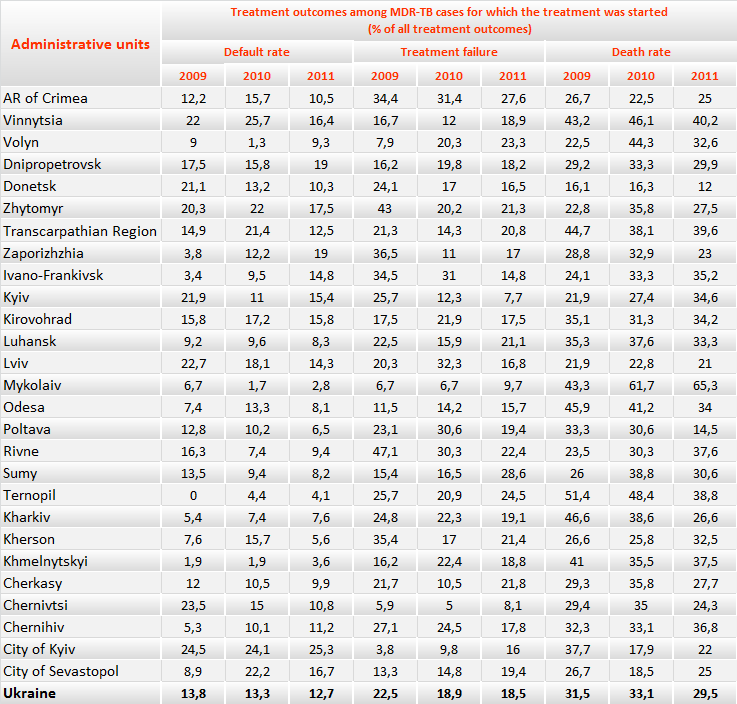
Treatment outcomes of MDR-TB patients
Obviously, the incomplete coverage with treatment of all patients with MDR-TB leads to the low efficiency, high mortality and proportion of treatment failure. WHO recommends a treatment success rate for MDR-TB cases should be at least 75%. Recent data (treatment outcomes of patients recruited to the cohort of 2011) show that the highest rates of treatment success were observed in three regions: Donetsk (58.2%), Poltava (58.1%) and Chernivtsi (51.4%) (see Table 11). However, even these rates are far from the established goals. Total in Ukraine successfully completed treatment for MDR-TB cases is only in 34.2%. The lowest treatment success rate in the cohort of 2011 was recorded in Mykolaiv Region – only 18.1%.
Table 11. Percentage of “treatment success” among MDR-TB cases for which the treatment is started in Ukraine by regions from 2009 to 2011*
|
Administrative units |
2009 |
2010 |
2011 |
|
AR of Crimea |
20 |
22,5 |
31,6 |
|
Vinnytsia |
15,4 |
13,3 |
22,1 |
|
Volyn |
59,6 |
32,9 |
34,9 |
|
Dnipropetrovsk |
28,6 |
22 |
24,1 |
|
Donetsk |
33,9 |
50,8 |
58,2 |
|
Zhytomyr |
13,9 |
21,1 |
33,8 |
|
Transcarpathian Region |
14,9 |
26,2 |
27,1 |
|
Zaporizhzhia |
26,9 |
37,8 |
31 |
|
Ivano-Frankivsk |
34,5 |
21,4 |
33,3 |
|
Kyiv |
25,7 |
46,6 |
41 |
|
Kirovohrad |
24,6 |
18,8 |
24,6 |
|
Luhansk |
26,6 |
32,5 |
33,3 |
|
Lviv |
35,2 |
24,4 |
47,9 |
|
Mykolaiv |
43,3 |
30 |
18,1 |
|
Odesa |
30,3 |
30,5 |
38,6 |
|
Poltava |
28,2 |
26,5 |
58,1 |
|
Rivne |
13,1 |
27,9 |
28,2 |
|
Sumy |
37,5 |
27,3 |
25,5 |
|
Ternopil |
22,9 |
22 |
30,6 |
|
Kharkiv |
17,6 |
24,5 |
39,2 |
|
Kherson |
27,8 |
34 |
32,5 |
|
Khmelnytskyi |
36,2 |
38,3 |
37,5 |
|
Cherkasy |
30,4 |
31,6 |
32,7 |
|
Chernivtsi |
41,2 |
35 |
51,4 |
|
Chernihiv |
26,3 |
25,2 |
26,3 |
|
City of Kyiv |
30,2 |
40,2 |
34 |
|
City of Sevastopol |
33,3 |
40,7 |
22,2 |
|
Ukraine |
27,2 |
29,3 |
34,2 |
*Data sourced from the Analytical statistical handbooks “Tuberculosis in Ukraine” of the relevant years.
Treatment success rate is influenced by many factors; one of the most important factors is the toxicity of second-line anti-TB drugs, which WHO recognized as one of the most toxic drugs. To reduce this effect it is very important to prevent adverse reactions (monitoring of side effects according to the Protocol) as well as their timely and qualitative treatment. However, in practice appropriate measures are not always taken promptly, it is related to non-compliance with monitoring and treatment of side effects and limited funding from the city budget. Other factors influencing treatment success rate will be discussed below.
Still it is not possible to reach on average across Ukraine the target for default rate among cases MDR-TB that according to WHO recommendations should be ≤5%. Although, for the cohort of 2011, default rate for MDR-TB cases in three regions was less than 5%. These are the following regions: Ternopil (4.1%), Khmelnytskyi (3.6%) and Mykolaiv (2.8), it is worth analysing the present outcomes with reference to other results, in particular such as treatment success and death rate. For example, Mykolaiv Region has the lowest treatment success rate (18.1%) and highest rate of deaths (65.3%). Therefore, the low level of interrupted treatment (defaults) is not an evidence of the effective work of the system in this case.
Therefore, it is important to consider all treatment outcomes for integrated assessment of the regions. Table 12 below presents the data on the rates of interrupted treatment, treatment failure and death cases among MDR-TB cases, for which the treatment was started in 2009-2011.
Table 12. Treatment outcomes among MDR-TB cases for which the treatment is started in Ukraine by the regions from 2009 to 2011 (% of all treatment outcomes)*
*Data sourced from the Analytical statistical handbooks “Tuberculosis in Ukraine” of the relevant years.
Figures 15-17 in the form of pie charts show treatment outcomes of MDR-TB patients in 2009-2011. Among patients recruited for treatment in 2009 in Ukraine in total percentage of deaths was higher than the percentage of treatment success (32% and 27%, respectively). This is primarily due to the limited access to second-line TB drugs and inability to complete the prescribed regimens in full.
The percentage of treatment failure also remains consistently high among MDR-TB patients. In particular, in 2009 this rate was 22.5%, in 2010 - 18.9% and 18.5% in 2011. This trend is a consequence of prescription of incomplete treatment regimens, resulting in aggravation of the Mycobacterium resistance profile of a TB patient and chronic forms of tuberculosis. Inadequate measures of infection control in TB facilities lead to cross-contamination between patients with TB Mycobacterium, which also leads to aggravation of TB Mycobacterium resistance profile of a patient. WHO recommends trying to decrease treatment failure rates to less than 10%. In Ukraine only in 3 regions treatment failure rates among MDR-TB patients were less than 10%. The lowest rates of treatment failure in the cohort of MDR-TB patients of 2011 were registered in Kyiv (7.7%), Chernivtsi (8.1%) and Mykolaiv (9.7%) Regions, with the highest rates in ARC (27.6%), and Ternopil (24.5%) and Sumy (28.6%) Regions.
Similarly, according to the WHO recommendations death rate among MDR-TB patients should not exceed 10% of all treatment outcomes. In total for Ukraine percentage of deaths among MDR-TB patients remained almost unchanged over the past few years, from 2009 to 2011, it decreased only by 2%. In 10 regions there was its growth during this period. The most dramatic increase in the percentage of lethal cases among MDR-TB patients is observed in Mykolaiv Region – an increase by 21.9%, Rivne – by 14.1% and Kyiv – by 12.7%. Such negative treatment outcomes in MDR-TB patients signal about untimely diagnosis and adequate treatment prescription, i.e. according to TB Mycobacterium resistance profile of a patient (DST), interruptions in the supply of anti-TB drugs and non-compliance with MDR-TB case management standards.Note that in this analysis when calculating “treatment failure” rates there were included two treatment outcomes in it: “treatment failure” and “continued treatment”, because the lack of treatment outcomes 24 months after the therapy indicates that it did not give positive results and the patient should be transferred to palliative care under the Protocol.
There is still a certain percentage of patients (about 5%) who still receive treatment outcome “withdrawn/transferred out”, although according to WHO recommendations, this rate is to be closer to zero. Thus, all patients should enter the reporting regardless of the change of residence on the territory of Ukraine, especially taking into account the implementation of All-Ukrainian electronic TB case-based data manager, which makes it possible to promptly track the movement of patients, to manage their transfer within the TB service and to record treatment outcomes by the place of registration of the case in the cohort analysis.
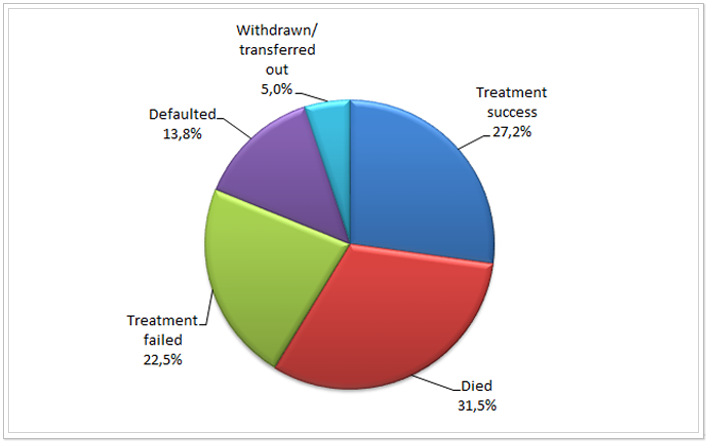 Figure 15. Treatment outcomes among MDR-TB cases, for which the treatment was started in Ukraine in 2009 (%)*
*Data sourced from the Analytical statistical handbook “Tuberculosis in Ukraine”, 2009.
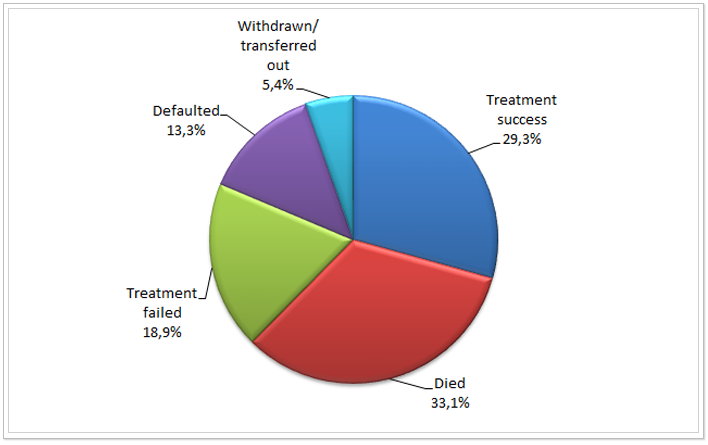 Figure 16. Treatment outcomes among MDR-TB cases, for which the treatment was started in Ukraine in 2010(%)*
* Data sourced from the Analytical statistical handbook “Tuberculosis in Ukraine”, 2010.
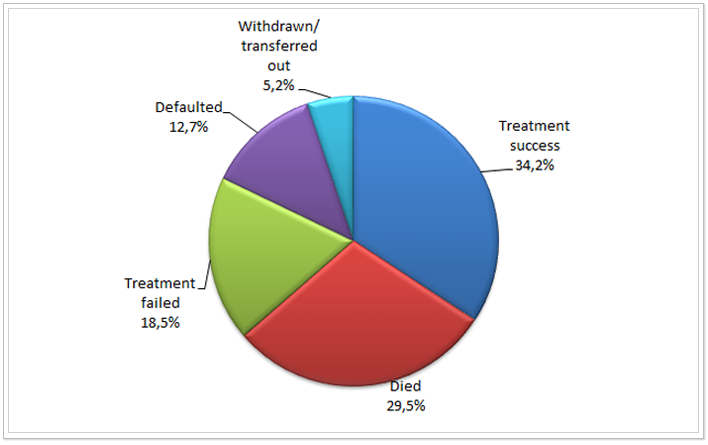
Figure 17. Treatment outcomes among MDR-TB cases, for which the treatment was started in Ukraine in 2011 (%)*
* Data sourced from the Analytical statistical handbook “Tuberculosis in Ukraine”, 2011.
Another important component in overcoming the epidemic of tuberculosis, along with timely and qualitative diagnosis, controlled and standardized treatment is adherence to infection control at all stages of TB activities. An informative indicator of compliance with infection control in health care institutions is the proportion of notification of TB among health care workers to TB among general population of Ukraine. WHO recommends that the proportion rate is to be close to one, i.e. when the notification rate among health care workers is the same as among general population, this indicates satisfactory measures of infection control in health facilities. As can be seen from Table 13, the ratio between the notification rate of health care workers of all healthcare institutions of Ukraine and notification rate in the general population is really close to one. Only in six regions in 2013 this ratio was greater than 1, but not significantly. In particular, in the City of Sevastopol it was 1.16; ARC - 1.21; in Kherson Region ̶ 1.1; in Chernivtsi – 1.07; in Cherkasy – 1.11 and in Luhansk – 1.15. On average over Ukraine, the ratio between the notification rate of health care workers and the general population did not exceed one for the past 4 years and ranged between 0.83 and 0.72.
Table 13. The proportion of notification of TB among health care workers of the health care system/TB facilities and among the general population (per 100 ths.) in Ukraine by the regions from 2010 to 2013*
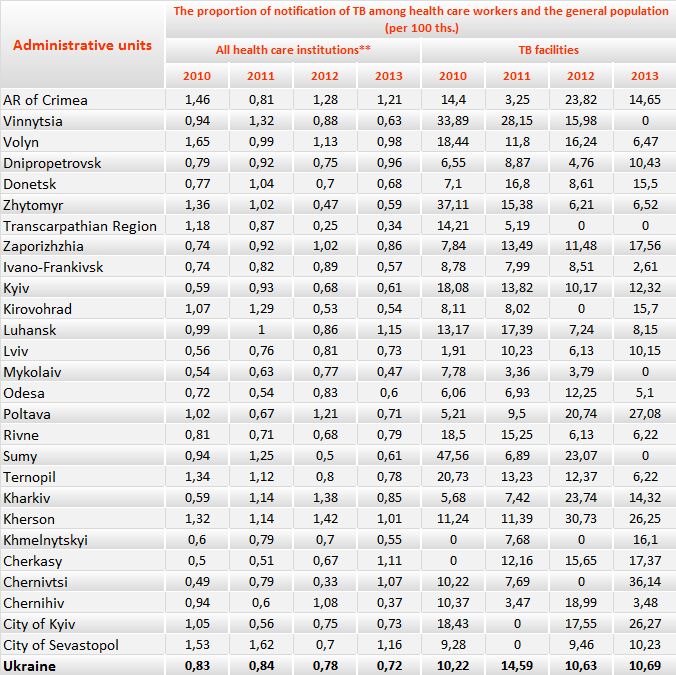
*Data sourced from Reporting form No. 33 – short “Report on TB patients for ________ quarter 20 ” and reporting form TB-07 of the relevant years”.
** Including TB dispensaries.
However, we receive absolutely opposite data, if we analyse the notification rate among health workers of exclusively TB facilities (TBF) and the general population. The same Table 13 shows that only in four regions (Vinnitsa, Transcarpathian Region, Mykolaiv and Sumy) notification rate among TBF workers is lower than among the general population in 2013. In the remaining regions it is significantly greater than 1, i.e. the workplace of workers of TB facilities significantly increases their risk of getting TB. Thus, the highest notification rate was observed in 2013 in Kherson (26.25), Poltava (27.08), Chernivtsi (36.14) Regions and the City of Kyiv (26.27). This indicates the poor infection control measures, as well as poor working conditions and stay in TB facilities in these regions.
A valuable indicator of the priority level and public support of measures to combat tuberculosis is the staffing level of phthisiologists with individuals under legal acts (%). Unfortunately, in the last 5 years this rate has not changed – staffing level of phthisiologists in health care institutions of the MOH of Ukraine remains incomplete, at 70-71% (see Table 14).
Table 14. Staffing level of phthisiologists with individuals under legal acts (%) from 2009 to 2013*
|
Administrative units |
2009 |
2010 |
2011 |
2012 |
2013 |
|
AR of Crimea |
74,8 |
72,9 |
69,1 |
68,8 |
67,8 |
|
Vinnytsia |
75,1 |
78,7 |
77,6 |
77,4 |
78 |
|
Volyn |
74,7 |
71,5 |
69,7 |
75,6 |
75,6 |
|
Dnipropetrovsk |
62,7 |
63,5 |
66,2 |
67 |
65,3 |
|
Donetsk |
59,8 |
58 |
57,8 |
59,7 |
59,7 |
|
Zhytomyr |
62,1 |
62,4 |
62 |
62,6 |
66,7 |
|
Transcarpathian Region |
90,5 |
96,9 |
96 |
96 |
94,9 |
|
Zaporizhzhia |
63,3 |
62,1 |
64 |
63,7 |
64,7 |
|
Ivano-Frankivsk |
88,4 |
89 |
90,7 |
94,9 |
97,5 |
|
Kyiv |
59,3 |
58,1 |
55,9 |
54,3 |
56,7 |
|
Kirovohrad |
56,1 |
59,2 |
58,2 |
57,9 |
58,2 |
|
Luhansk |
64,1 |
66,1 |
64,8 |
66,2 |
72,2 |
|
Lviv |
88,6 |
90 |
90,5 |
88 |
87,4 |
|
Mykolaiv |
60,1 |
63,3 |
59,8 |
63,5 |
64 |
|
Odesa |
67,2 |
66 |
64 |
65,6 |
65,8 |
|
Poltava |
80 |
79,8 |
74,9 |
74,9 |
76,2 |
|
Rivne |
72,8 |
71,2 |
72,5 |
77,74 |
76,8 |
|
Sumy |
71,6 |
68,2 |
67,3 |
75,9 |
77,1 |
|
Ternopil |
90,2 |
90,3 |
92,7 |
87,5 |
96 |
|
Kharkiv |
74,1 |
70 |
69,4 |
70,7 |
73,4 |
|
Kherson |
68,2 |
66,7 |
66,7 |
67,6 |
59,4 |
|
Khmelnytskyi |
75,3 |
76 |
78,3 |
82,6 |
87,4 |
|
Cherkasy |
63,7 |
58,5 |
62 |
70,2 |
69,5 |
|
Chernivtsi |
79,3 |
90,6 |
89,8 |
90,8 |
96,3 |
|
Chernihiv |
74,6 |
74,2 |
74,5 |
74,4 |
71,4 |
|
City of Kyiv |
64,3 |
69,1 |
63,1 |
64,8 |
62 |
|
City of Sevastopol |
75,2 |
69,4 |
66,1 |
72,7 |
68,4 |
|
Ukraine |
70 |
70,1 |
69,5 |
70,9 |
71,5 |
* Data sourced from form No. 20 “Report of medical and preventive treatment facility for ___” of the relevant years.
As can be seen from Table 14, the best staffing level of phthisiologists is in the western regions of Ukraine, in particular in Ternopil, Transcarpathian and Ivano-Frankivsk regions, where from 2009 to 2013 the staffing level of phthisiologists increased from 88-90 to almost 95%. At the same time, in Kyiv, Donetsk and Kirovohrad Regions this rate does not even reach 60%, which negatively affects the quality of TB services. A significant variation in the values of this indicator is due primarily to the significant work stress of phthisiologists in regions with a high incidence rate of tuberculosis, heavy workload and, therefore, insufficient wages.
Conclusions
Despite the fact that in recent years Ukraine managed to achieve certain stabilization of processes of incidence and mortality from TB, the epidemic process is still a concern, acquires new characteristics and requires confident action towards its elimination. In particular it is necessary to respond quickly to the rapid growth of HIV/TB co-infection and MDR-TB.
In order to reduce the incidence rate of TB among patients with HIV infection it is necessary to ensure timely prescription of ARV therapy among HIV-infected and Isoniazid prophylaxis. To reduce mortality rate among patients co-infected with TB/HIV, they should receive Co-trimoxazole prophylaxis in accordance with the unified clinical protocols of primary, secondary (specialized) and tertiary (highly specialized) health care “Tuberculosis”.
Unfortunately, in Ukraine there is still no clear picture of the prevalence of multi-drug resistant tuberculosis. Based on the international experience, it can be argued that the data of the study to determine the prevalence of resistant Mycobacterium strains of tuberculosis in Ukraine, which has been completed by WHO this year, will be higher than routine surveillance data. The increase in the incidence rate of MDR-TB indicates problems with provision of controlled treatment in the previous years, as well as interruptions in the supply of anti-TB drugs.
In view of the above stated, to ensure effective response to the epidemic it is necessary to:
- Establish a monitoring and evaluation system, one of the components of which is recording and reporting, in particular to bring it into full compliance with the international standards. As only objective and reliable statistics can serve as a source of information for managerial decisions, both at local and national levels.
- Ensure the provision of reliable data at all levels of reporting through regular monitoring visits with sufficient frequency rate (at least 2 times a year). Monitoring visits with elements of supervision are designed not only to check the operation of all levels of care for patients with tuberculosis, but also to train specialists in the workplace, to provide guidance and practical advice to remedy deficiencies in the work and to monitor their performance.
- Implement the TB Protocol in full at all levels of care.
- Bring in line with international approaches of the procurement and management of anti-TB drugs and consumables at all levels.
- Implement the practice of researches of economic and program effectiveness of different TB program activities. The Ministry of Health of Ukraine, as the chief executive and regulatory body, shall be the customer and initiator of such researches.